

 Back to All
Nearly 400 hydropower facilities across the United States are expected to undergo relicensing within the next decade. As part of that process, many operators will consider installing or upgrading fish passage technologies, systems that help migratory species bypass dams so that they can survive, reproduce, and replenish the nation’s fisheries. But until recently, there was no comprehensive, centralized source of information about existing fish passage facilities in the U.S., such as their number and locations.
To fill this gap, researchers at Oak Ridge National Laboratory collaborated with staff from the US Fish and Wildlife Service, the National Oceanic and Atmospheric Administration, and the Low Impact Hydropower Institute to create a database and interactive digital map that identify fish passage facilities in the lower 48 states. Each entry includes detailed information such as the type of fish passage structure, the fish species present in the area, and, in some cases, how much the facility cost. Follow the links to access the digital map or the database.
The database is intended to help hydropower operators streamline the licensing or relicensing process and inform decision-making by providing accurate, geo-referenced data about fish passage, said Principal Investigator Paul Matson.
“This is particularly important in today’s rapidly evolving hydropower landscape,” Matson said. “It will act as an aid and a benchmark to the hydropower community as it seeks to modernize and strengthen the fleet.”
With funding from the U.S. Department of Energy’s Water Power Technologies Office, now known as the Hydropower and Hydrokinetic Office, the research team achieved the first comprehensive accounting of fish passage facilities in the contiguous United States in more than 30 years. Their findings greatly surpassed the only previous attempt, a 1993 survey, in terms of scope and thoroughness.
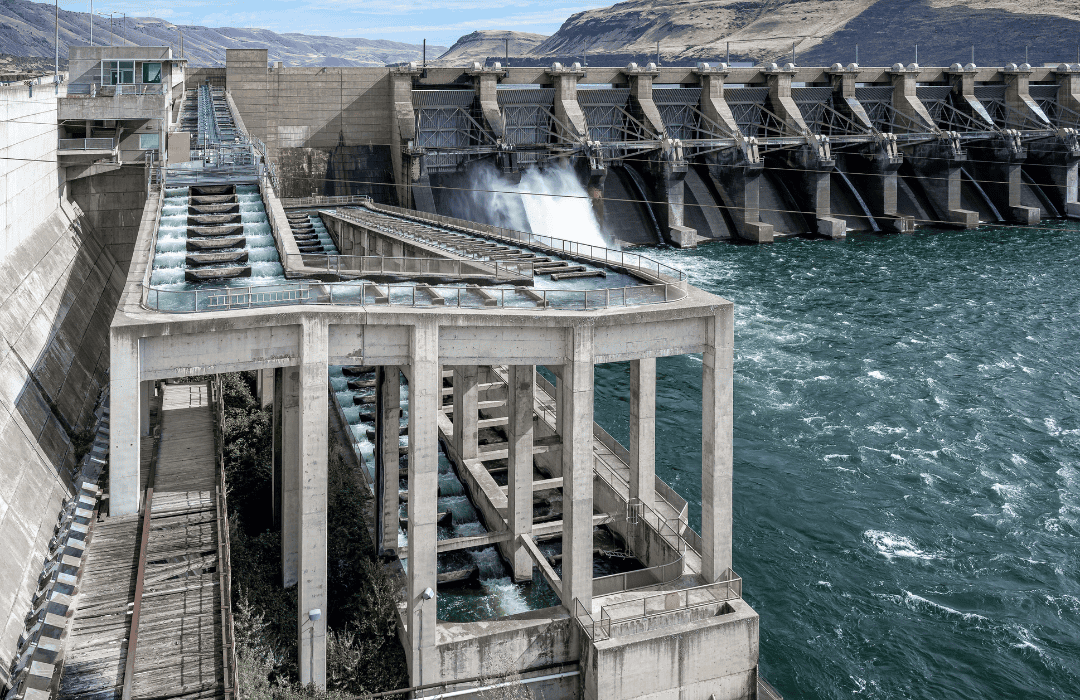
A fish ladder at John Day Dam provides passage upstream for salmon, steelhead, sturgeon, and eel in the Columbia River. Credit: Dominic Gentilcore [image via Adobe Stock]
FROM FOUNDATIONAL DATA TO ‘CONSUMER REPORTS’ FOR HYDROPOWER
The team published its nationwide overview of fish passage facilities using information from the database in the journal Environmental Management in July 2025. The findings verified whether fish passage facilities exist at 1,909 of the 2,729 hydropower features included in the dataset. In this case, a “hydropower feature” is defined as a dam or other piece of discrete infrastructure, like a powerhouse or conduit, that controls the flow of water at a specific location in a river system for the purpose of hydropower production. More than one hydropower feature may be present at what one may think of as a single hydropower project, but each feature is an individual barrier to fish movement.
The team defined a “fish passage facility” as a structure that is intentionally designed for that purpose alone. The team decided not to include structures like navigation locks or operational protocols like nighttime shutdowns, which may incidentally allow fish to pass, or turbines that have been designed to reduce fish mortality.
Matson said that obtaining a true account of fish passage facilities at 70% of the hydropower features in the dataset was a feat, considering the decentralized state of the information. The process involved gathering data from many different sources, including many direct inquiries via cold-calling and email. If the team encountered conflicting information about a facility, it confirmed the facts with the parties responsible for the site or through aerial imagery. Much of the remaining 30% that is currently unaccounted for falls into two regions: California and the Mountain West. The team is still working to collect this information.
ORNL researchers also analyzed the data for patterns. One of the first insights to emerge was a clearer picture of the general lack of fish passage infrastructure in the U.S. Only 20% of the hydropower features in the dataset had a fish passage facility.
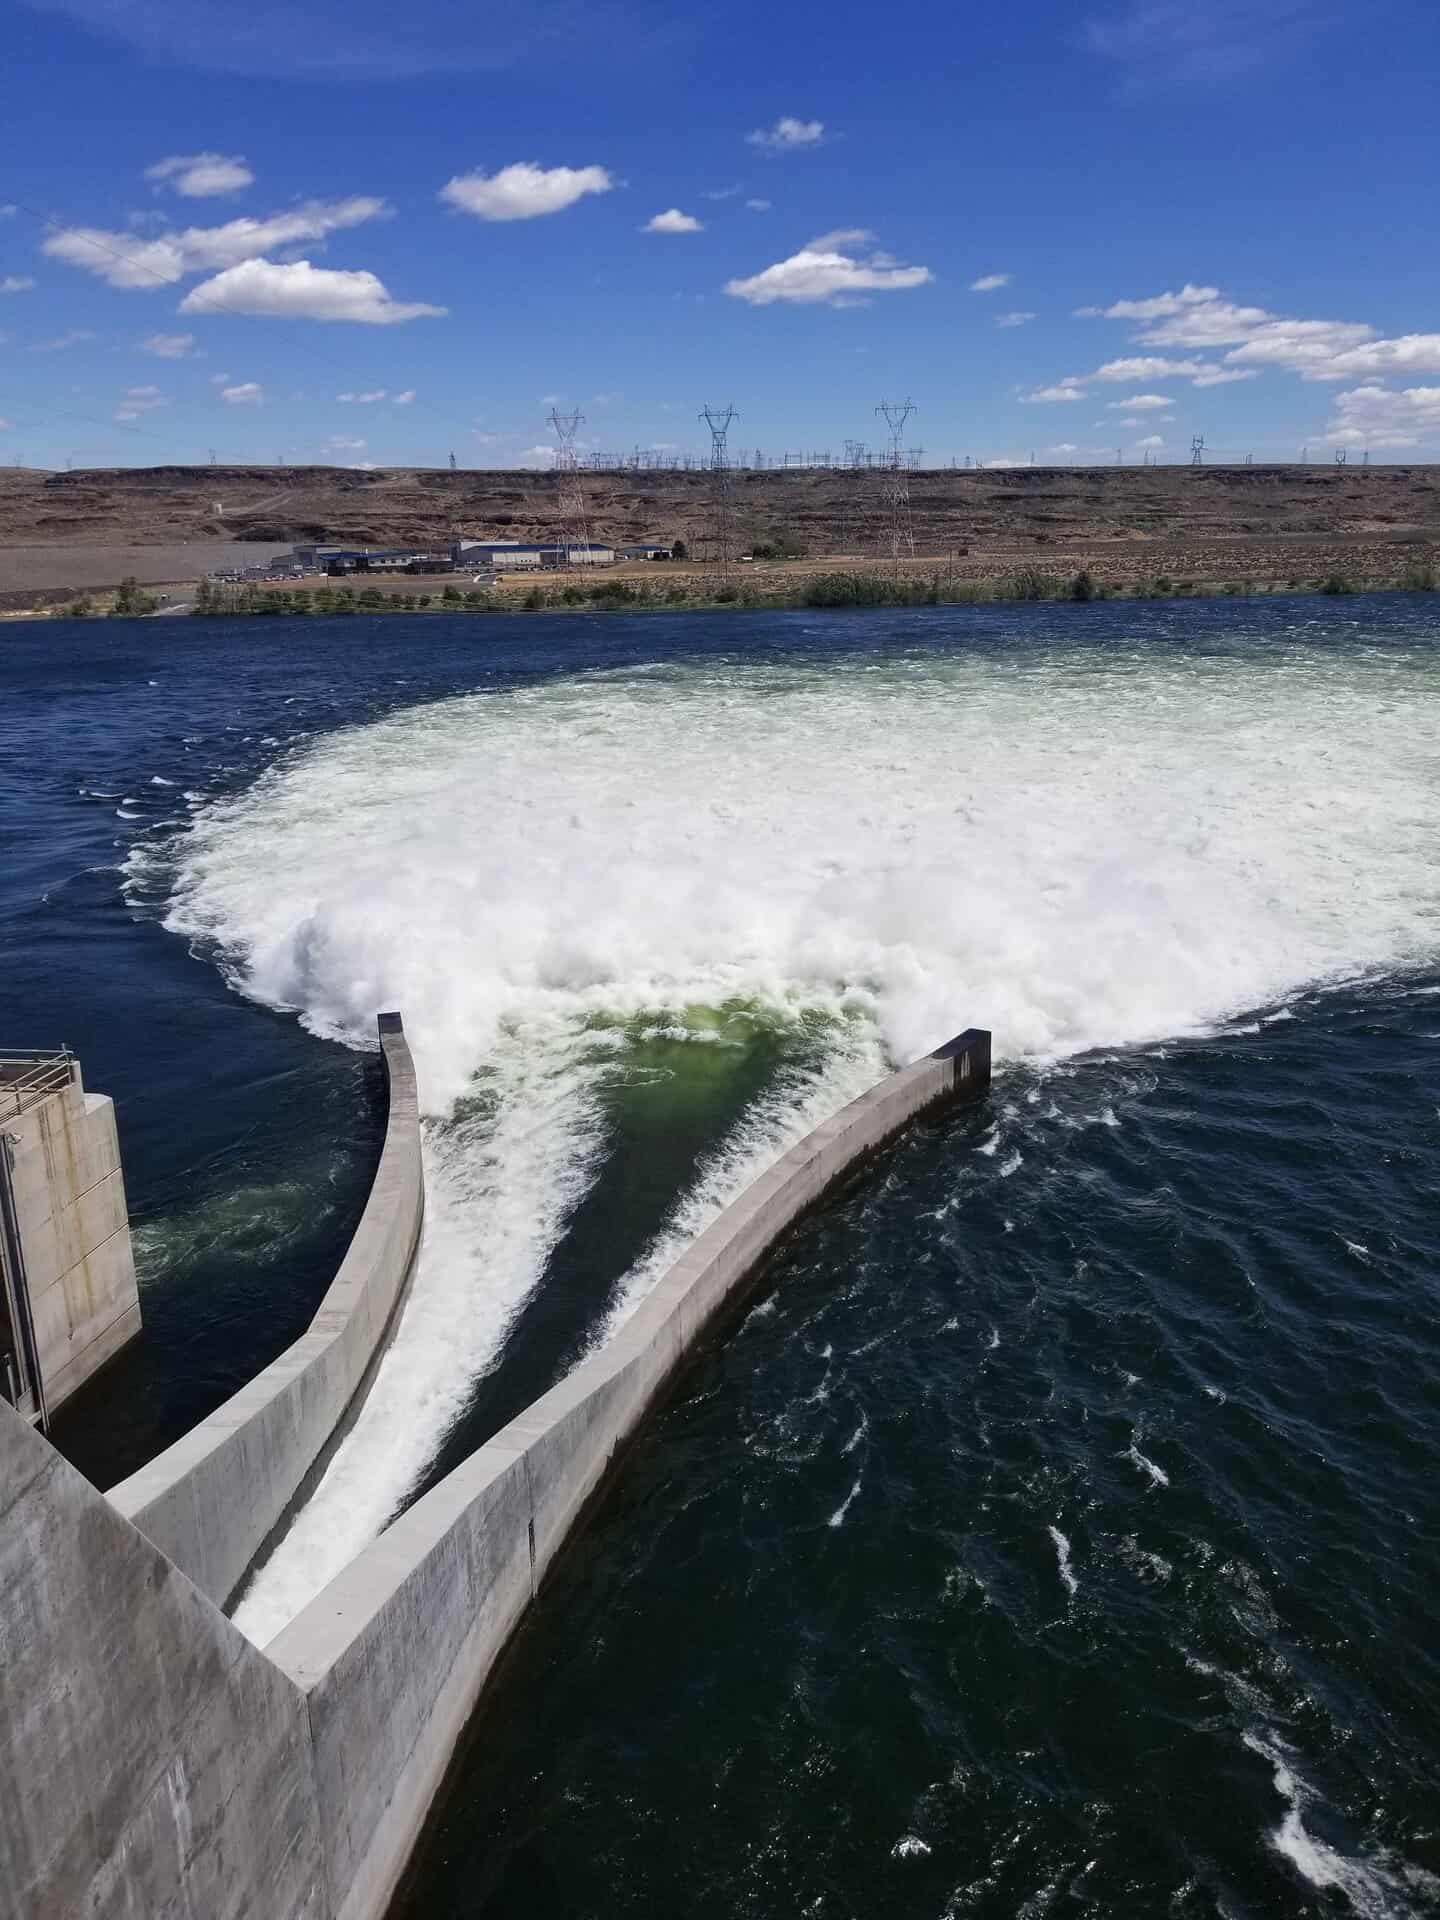
Fish bypass infrastructure at the Wanapum Dam. Credit: Dave Dempsey [image via DOE Flickr, Make a Splash photo contest album]
The team was also able to pick up on some broader trends. New England has the highest number of fish passage facilities, followed by the Great Lakes and Pacific Northwest regions.
Of the various types of fish passage, bypasses are the most common, accounting for 38% of all facilities in the census, followed by fish ladders (22%), passageways specifically designed for eels (13%), spillway passage (9%), trap and transport (6%), and fish lifts (5%).
Now that there is a repository of basic information, Matson has set a new task for the team: to evaluate the performance of the various types of fish passage technologies.
“We want to figure out which types of fish passage design work well, and also what could be improved,” Matson said. “It will be a kind of Consumer Reports for the hydropower industry.”
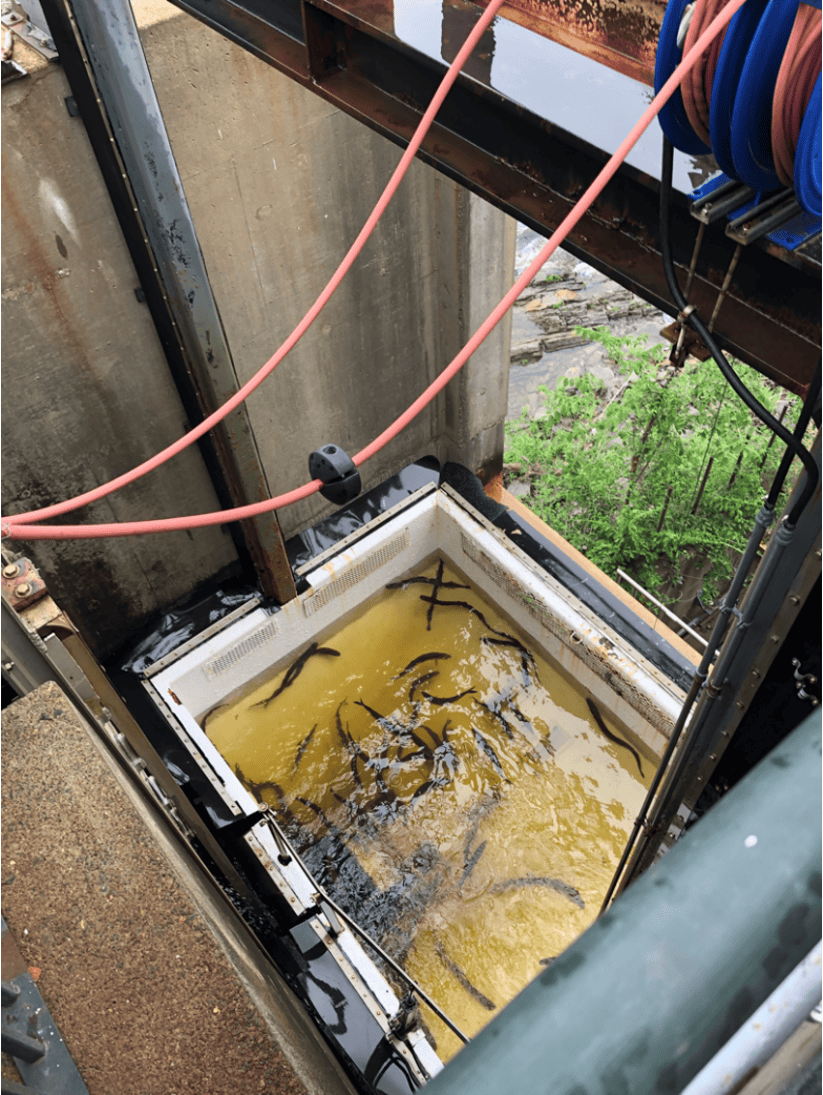
A fish lift in action at the Lowell Hydropower Project on the Merrimack River in Lowell, Massachusetts. Credit: Shannon Ames [image used with permission from owner]
NEXT STEPS
If you wish to contribute to ORNL’s fish passage dataset, either with a new facility location or performance information, please contact Matson at [email protected].

