



 Back to All
Sponsored Content
The most consequential parts of a hydro asset are the parts nobody looks at directly. Trash racks, gate slots, draft tube liners, upstream faces, scour at the toe — the components that drive unit availability and dam safety findings are the same ones that live under water for decades between dewatering. For most of a facility’s life, the only record of their condition is a video file shot by a diver.
That record is being asked to do considerably more work than it used to.
The record has to outlive the dive
Three shifts are converging on the North American fleet. Assets are older, so condition data has to support real capital decisions rather than confirm a known-good state. Dewatering windows are narrower and more expensive, so more inspections happen in the wet. And condition information is increasingly consumed downstream — by dam safety engineers building a Part 12D case, by asset managers ranking spend across a portfolio, and now by software: photogrammetry, defect-detection models, digital twins.
Every one of those downstream uses depends on the same thing. Not on the dive. On the file.
This is where a lot of hydro inspection programs quietly have a problem. A significant share of the diver video sitting in North American facility archives was captured on standard-definition analog systems — typically a 720×480 interlaced signal, composite output, fixed lighting, timecode burned into the corner. That equipment did the job it was built for: giving a topside supervisor a live look and proving a dive happened. It was never a measurement instrument, and never the input layer for an analytics stack that did not exist when it was designed.
The uncomfortable version of the question: if a defect is present in your 2021 footage but not resolvable in it, does your program know about that defect?
What the Comparison Showed
J.F. Brennan Company and Reach Systems compiled a direct side-by-side of two diver camera systems — the legacy analog unit used on earlier campaigns, and the Reach Digital Diver Camera System (DDCS). The footage was captured across four different facilities; within each pair, the same facility and the same structure under similar conditions. The set runs to more than a dozen paired views across submerged steel, concrete surfaces and heavy biofouling, plus three split-screen video clips.
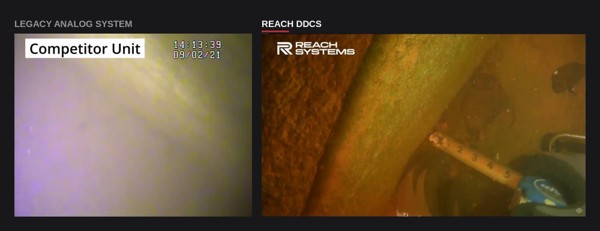
Figure 1 — A folding ruler held against a corroded structural member. The graduations stay legible, so the defect can be dimensioned after the fact.
Contrast and color. In turbid water the analog frames flatten toward a uniform milky field: light is returning to the sensor, but very little of it carries information about the structure. Its chroma noise —the purple and yellow casts across the comparison— is hard to separate from real staining or corrosion product, leaving an inspector to decide whether a discoloration is a finding or an artifact. The digital frames hold separation between the structure, the fouling on it, and the water column in front of it.
Resolvable detail. In the paired frames showing heavy biofouling, the digital record resolves individual shells and the boundary between colonized and clean substrate — the difference between a coverage estimate and an impression. The analog record shows that something is there.
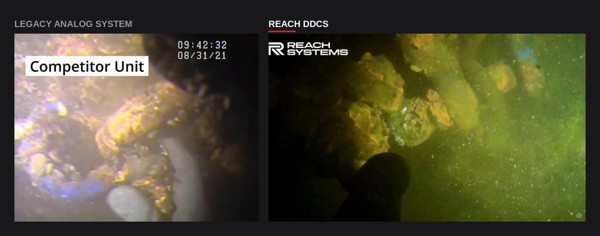
Figure 2 — Mussel colonization on submerged structure. Coverage extent and the colonized/clean boundary are readable in the digital record.
Usable stills. Most figures in a finished inspection report are stills pulled from video rather than separate photographs, and whether that works comes down to frame rate. Underwater, something is always moving — the diver, the current, the camera panning along a weld. At low frame rates that movement smears across each frame, and the grab an engineer wants comes out blurry or unusable. A higher frame rate means more candidate frames and less movement recorded in each one, so a sharp frame usually exists at the moment that matters. Crews describe this as one of the most immediately practical differences: the report gets its figure without going back in the water.
How the Dive was Run
The camera is the visible part of this. The process around it is what turned the footage into a record.
The supervisor watched the actual capture in real time. The DDCS runs a 17-inch daylight-readable topside display, so the person accountable for the report saw the frame the report would use while the diver was still on the structure. When a view was wrong, it was reshot in seconds. Historically that discovery happens back at the office, and the fix is another dive day.
Narration was recorded to the file. Audio from the diver, tender or supervisor lands on the same file as the image, so context does not live in a separate notebook. In practice, the supervisor calls out the exact location, the type of deficiency and anything else worth noting at the moment it is on screen, which takes the guesswork out of writing the report weeks later. And because the commentary sits in the audio rather than burned into the picture, the frame stays clean enough to drop straight into the report.
Sensor data was recorded with the imagery. Depth, temperature and heading are captured alongside the video, so every frame can be located on the structure rather than from memory.
The hardware supporting this: 1080p HD video, 1,500-lumen LED lighting, a sapphire viewport and aluminum housing rated to 300 m, and a portable topside control unit that sets up in minutes.
The largest single change, though, was not resolution. It was that the people responsible for the deliverable could see, while the diver was still down, whether they had it.
“With competing systems there were many times I wanted a still image for a report and the lower frame rate left me with something blurry. The 30FPS rate makes it far easier to pull a clear image out of the video and put it straight into the inspection report,” Joseph Baldoni, Underwater Inspection Program Manager, J.F. Brennan Company.
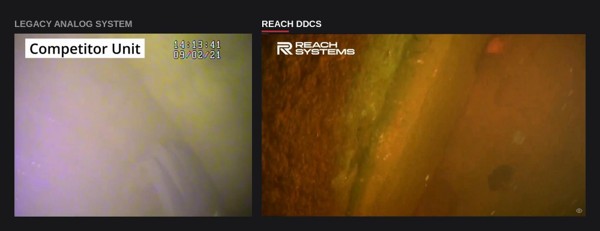
Figure 3 — Surface condition on a submerged member. Weld seam, corrosion texture and growth boundary separate cleanly in the digital frame; the analog frame returns light without information.
Four Tests for an Inspection Record
A useful audit of your own program — for any inspection file in the archive:
1. Can someone who was not there read it? The record is read by an engineer months later, not by the crew on the barge.
2. Can you measure from it? If defect dimensions exist only in a diver’s verbal report, the video is illustration, not evidence.
3. Can you locate it? A frame without depth, heading and position data is an image of a wall somewhere.
4. Can you compare it to next time? This is the one that gets skipped.
Starting Over
That fourth test is the whole argument. Condition assessment is a trending exercise: a single inspection tells you what a component looks like; a series tells you how fast it is changing, which is the input capital planning actually needs.
Trending only works if both ends of the comparison are readable. A facility whose 2021 baseline was captured on a system that could not resolve a hairline crack, a section-loss profile or a fouling boundary does not have a degraded baseline — for those features, it has none. The next dive is not comparing against 2021. It is starting over.
Which means the inspection happening this season is not only a report on current conditions. It is the reference frame for every inspection that follows it. That is a reason to treat capture quality as an asset-management decision rather than a dive-services line item.
J.F. Brennan Company and Reach Systems will be at Clean Currents 2026 in Phoenix, September 21–25, with the full side-by-side comparison and the DDCS available to handle.

